
How to Draw Fibonacci Retracement in Cryptocurrency Trading
In short
How to draw Fibonacci retracement in cryptocurrency trading: which two points to anchor, which direction to drag, and the mistakes to avoid.
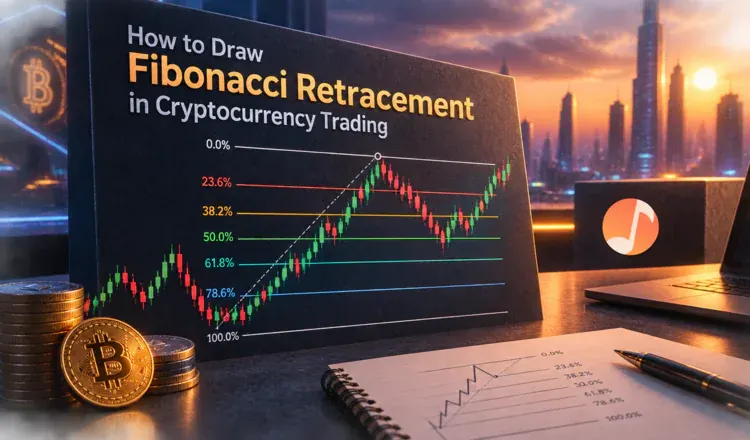
Drawing a Fibonacci retracement takes two clicks: the start of a move and its end. Everything the tool shows you depends on those two points, so picking them is the whole skill. On an upward move you click the swing low first and drag to the swing high; on a downward move you do the reverse. The lines that appear mark how far the price has given the move back.
Picking the two points
Choose a move that is obvious — the kind you could describe to someone without pointing. If bitcoin ran from a clear bottom to a clear top and then started drifting back, those two turning points are your anchors. Vague, choppy stretches produce vague levels. One habit worth keeping: decide whether you anchor to candle wicks or candle bodies, and then do the same thing every time, because switching between them on the same chart is how people talk themselves into whatever level they wanted.
The actual steps
- Pick a timeframe and stay on it. A move on the 4-hour ether chart gives different levels from the same stretch on the daily.
- Open the Fib retracement tool — on TradingView it is in the left-hand drawing menu.
- Click the start of the move, then the end. Up move: low first. Down move: high first.
- Check the labels. The 0% line should sit at the end of the move and 100% at its start.
- Leave 23.6, 38.2, 50, 61.8 and 78.6 switched on and ignore the rest until they mean something to you.
Mistakes that make the levels useless
Dragging in the wrong direction is the common one: the levels still appear, they are simply upside down, and the 61.8% line you are watching is nowhere near where you think. Second is redrawing the tool until the lines agree with a trade you already want. Third is leaving a stale drawing on the chart — when the price makes a new high, that old move is finished and the retracement belongs to the new swing.
Draw the same move three times over a week without looking at your earlier attempts; if the anchors land in the same place each time, the move was clear enough to trade from. How to use Fibonacci retracement in crypto trading explains what the levels mean once they are on the chart, and market vs limit vs stop orders covers placing an order at one.