
Decoding Market Cycles With Wyckoff and Elliott Wave
In short
Decoding market cycles with Wyckoff and Elliott wave: how the four phases and the five-wave count describe the same cycle, and where the two disagree.
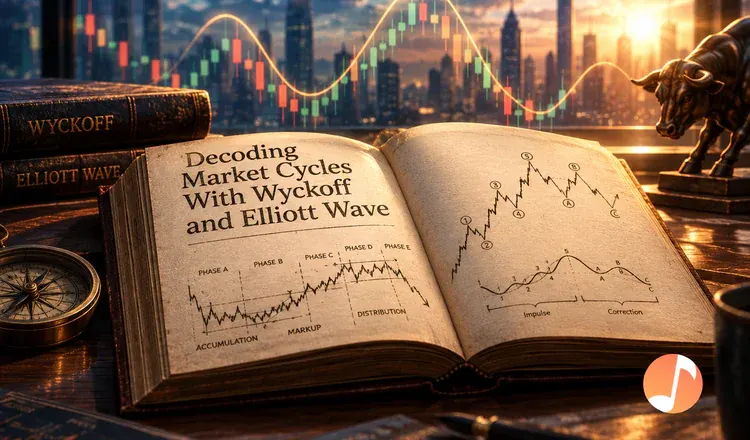
Wyckoff and Elliott wave are two maps of the same journey. Wyckoff splits a full market cycle into four phases: accumulation, markup, distribution, markdown. Elliott describes the same ground as a count: five waves in the direction of the trend, then three waves back the other way. Neither predicts anything on its own. Both are ways of asking the same question — is this move still building, or is it finishing?
Two descriptions of one cycle
Wyckoff's version is about who is doing the buying. A long sideways range after a fall is accumulation; the trend that follows is markup; another long range near the highs is distribution; the fall after it is markdown. Elliott's version is about shape. Waves 1, 3 and 5 push with the trend, waves 2 and 4 pull back against it, and the A-B-C that follows unwinds the whole thing. Lay them side by side and accumulation sits roughly where waves 1 and 2 form, markup covers wave 3, and distribution is the long, tired topping area around wave 5.
Where they genuinely agree
Both say that the strongest, cleanest part of a move comes after a boring, frustrating one. Wyckoff's sign of strength and Elliott's wave 3 describe the same thing: the stretch where participation widens and volume rises together with price. Both also say that the final push is the weakest — wave 5 typically has lower volume than wave 3, which is exactly what Wyckoff would call effort that no longer produces a result.
Where they disagree, and which to trust
Wyckoff is evidence you can point at: a range low, a failed break, a volume spike. Elliott is interpretation, and interpretations get revised. Any honest wave counter will tell you that counts change as new candles arrive, and a count that can be redrawn to fit any outcome is telling you nothing. The practical compromise most traders land on is to let Wyckoff describe what is happening in front of you and let Elliott hold the wider context loosely.
Pick one asset with a long history — Bitcoin is the obvious choice — and mark a single completed cycle both ways on the weekly chart. Doing it twice on the same data shows you faster than any article where the two methods overlap and where you were filling gaps with hope. The range mechanics are in Wyckoff chart patterns explained, and a workable daily routine is in mastering trading with Ichimoku and Elliott wave strategies.