
Wyckoff Chart Patterns Explained: Accumulation, Distribution and the Spring
In short
Wyckoff chart patterns explained simply: how accumulation and distribution ranges form, what the spring really is, and how to tell the two apart.
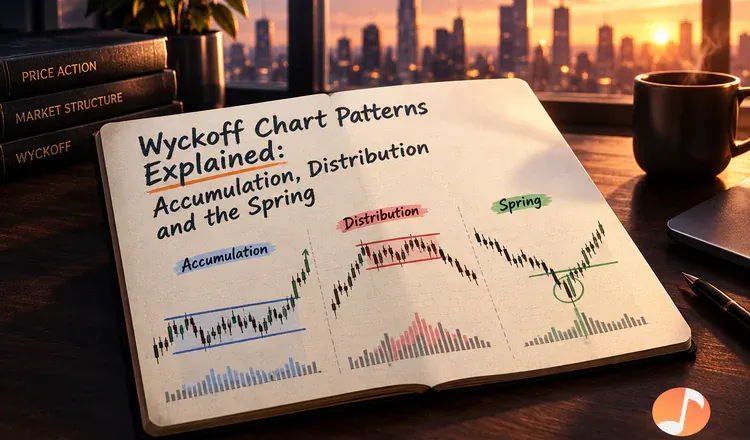
Wyckoff chart patterns describe what a sideways range is doing. Richard Wyckoff, a stock trader in early 1900s New York, noticed that large buyers cannot fill a big order in one go without pushing the price against themselves, so they work quietly inside a range instead. Accumulation is a range where they are buying. Distribution is a range where they are selling. The patterns are just the visible footprints of that work.
What happens inside an accumulation range
Think of someone filling a swimming pool with a garden hose while telling the neighbours the pool is broken. Price falls hard, stops, and then chops sideways for weeks. The usual sequence looks like this:
- Selling climax — a sharp drop on huge volume as the last frightened holders give up.
- Automatic rally — a quick bounce once that selling dries up, which sets the top of the range.
- Secondary test — price returns to the lows on noticeably lighter volume, the first hint that sellers are spent.
- Spring — a brief dip below the range low that snaps straight back inside.
- Sign of strength — a strong push to the top of the range on rising volume, after which the range usually breaks upward.
Distribution is the same film in reverse
After a long run up, price stalls and ranges. The mirror of the spring is the upthrust: a poke above the range high that fails and falls back in, trapping breakout buyers instead of breakout sellers. The tell is the same in both directions — a big move in price that produces almost no follow-through. Wyckoff called that effort without result, and it is the single most useful idea he left behind.
Why the spring traps so many people
A spring works precisely because stop-loss orders sit just under an obvious range low. Pushing price there triggers them, which produces a burst of cheap selling for whoever wants to buy. The honest version of this on a Bitcoin chart is simple to check: did the break below hold for days, or did it reverse within a candle or two on volume that never followed through?
Practise on finished charts before live ones. Open a weekly Bitcoin or Solana chart, find a long sideways stretch, and mark the climax, the test and the break — knowing the ending removes the pressure and teaches the shape. Where this fits into the wider cycle is covered in decoding market cycles with Wyckoff and Elliott wave, and the indicator side of the same job is in advanced indicators explained.