
Fibonacci Retracement Levels: The Complete Crypto Trading Guide
In short
A complete guide to Fibonacci retracement levels in crypto trading: what 23.6%, 38.2%, 50%, 61.8% and 78.6% mean and why traders watch them.
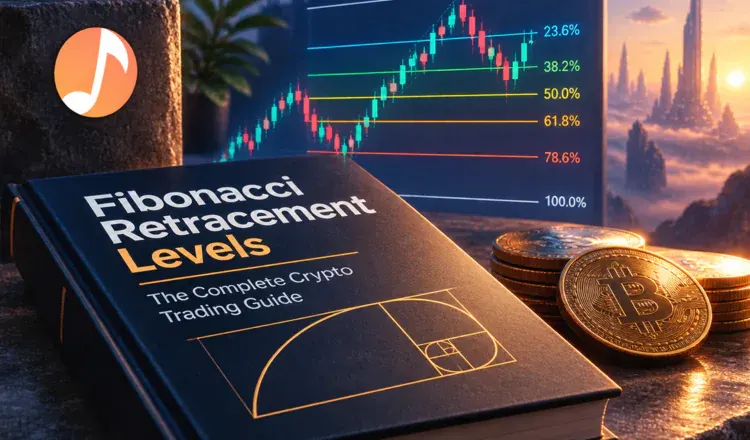
Fibonacci retracement levels are the horizontal lines a charting tool draws across a price move that has already finished: 23.6%, 38.2%, 50%, 61.8% and 78.6% of the distance it covered. They measure how much of a run the price has handed back. This guide goes through what each level is taken to mean in crypto trading, and where the idea stops being useful.
What the numbers actually measure
Picture a stretched spring. Let go and it snaps back part of the way, rarely all the way. A price move behaves a little like that, and the levels are simply marks on how far back it has travelled. If bitcoin climbs from $60,000 to $80,000, that $20,000 run is the measuring stick: a dip to $72,360 has given back 38.2% of it, a dip to $67,640 has given back 61.8%. Nothing more mysterious than arithmetic on two points you chose yourself.
What each level is taken to mean
- 23.6% — barely a pause. Seen in strong, fast trends where buyers will not wait for a real discount.
- 38.2% — a normal breather inside a healthy trend, and the shallowest level most traders bother acting on.
- 50% — not a Fibonacci number at all. It is there because halfway is a price people have always watched.
- 61.8% — the famous one, from the golden ratio. A deep but still ordinary correction, and the level most often quoted on ether and solana charts.
- 78.6% — nearly the whole move undone. Below it, most traders treat the original idea as finished and put their stop just underneath.
Why the levels work at all
Partly because enough people watch them that the orders themselves create the reaction. That is less impressive than it sounds, and more useful: a level is worth something when other things agree with it. A 61.8% line that lands on an old support price, a round number such as $50,000, and a moving average is a crowded spot. The same line floating in empty space is decoration.
Pick a move on a bitcoin daily chart from last year, mark the levels, then scroll forward and count how many the price respected. That one exercise will tell you more about what to expect than any rule. If you have not drawn the tool before, start with how to draw Fibonacci retracement, then see how traders turn a level into an actual trade.