
How to Trade Using Volume Profile and VWAP Combos
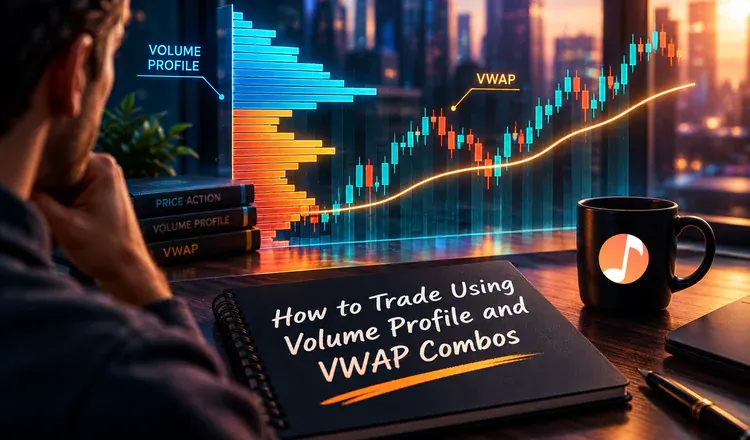
Volume profile and VWAP answer two different questions, which is exactly why traders put them on the same chart. The profile shows where the trading happened - a sideways histogram of how much volume changed hands at each price. VWAP shows the average price paid over a stretch of time. A combo is simply a spot where both tools point at the same price, and the reason to care is that a lot of people bought or sold around there.
What each tool contributes
From the profile you take three readings: the point of control, the single price with the most volume behind it; the value area, the fat middle where most of the volume traded; and the thin patches, prices the market passed through quickly. From VWAP you take one line. Anchor it to a day that mattered - the session a coin like Solana made a local high, or the day of an Ethereum upgrade - and the line tells you roughly what everyone who has traded since then paid.
What a confluence actually means
Think of a crowded shop. The point of control is the aisle where most customers stood; the anchored VWAP is the average amount they spent. When both land on the same price, that price is both "where the business was done" and "the average buyer's break-even". Traders treat it as a decision point rather than a signal: they watch how price behaves when it arrives there - does it stall and turn, or slice straight through - and they know in advance where the idea is wrong, which is just beyond the level.
The combo that catches people out
The one to be careful with is a confluence that forms on thin data. If Bitcoin only spent two hours in a range, its point of control is barely a point of control, and an anchored VWAP started this morning is an average of almost nothing. Both tools get more meaningful the more volume sits underneath them. Check the exchange feed too - volume on a small venue is a different picture from volume on a large one, and the profile is only ever drawing the market you selected.
Start by marking just two levels on a chart you already follow and watching them for a week before you act on anything. If the pieces are still fuzzy, read what VWAP measures first, then volume profile and AVWAP.