
Bitcoin at $1.6T Is 1% of Global Money, a Conference Slide Says
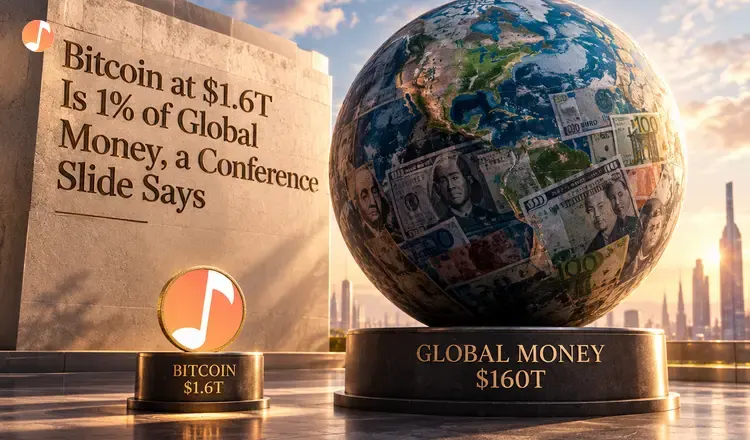
A pie chart circulating from a Bitcoin conference account gives Bitcoin $1.6 trillion, or 1.0% of the world's money. The rest of the slide is the comparison. Chinese yuan, gold, the US dollar, the euro, the yen and the pound take the other wedges, and the eight values add to $157.0 trillion. One of those wedges matches the official series to the decimal. Two of them do not match the sources this desk could reach.
What the slide counts
The chart splits global money into eight wedges, each labeled with a dollar value and a share.
- Chinese yuan, $52.8 trillion (33.6%)
- Gold, $31.1 trillion (19.8%)
- US dollar, $23.2 trillion (14.8%)
- Euro, $18.9 trillion (12.0%)
- Other fiat currencies, $15.1 trillion (9.6%)
- Japanese yen, $10.0 trillion (6.4%)
- British pound, $4.3 trillion (2.7%)
- Bitcoin, $1.6 trillion (1.0%)
Add the wedges and the total is $157.0 trillion. Divide each value by that total and every printed share lands within a rounding step of the one on the chart. The internal arithmetic holds. Whether the inputs do is a separate question.
The dollar wedge is exact
US M2, the Federal Reserve's measure of cash, checking balances and savings deposits, stood at $23,218 billion in July 2026, the most recent monthly reading carried by the St. Louis Fed. That is $23.2 trillion. The slide's dollar figure matches the Fed series to the decimal, which suggests the fiat wedges are M2 aggregates rather than a narrower measure of cash in circulation.
Bitcoin's own wedge is close. Coinbase's price page showed a market value of $1.56 trillion at the time of writing, and YCharts put the figure at $1.563 trillion for 14 September, up from $1.550 trillion the day before. The slide rounds to $1.6 trillion. At $1.56 trillion the share of a $157 trillion total works out at 0.99%, not 1.0%, a rounding artifact, not an error. Bitcoin has been holding near $78,000 this week, so the wedge moves with the price.
Gold is where the numbers part
The slide puts gold at $31.1 trillion. CompaniesMarketCap, which derives the same figure from above-ground reserves and the spot price, showed $30.203 trillion at the time of writing. The gap is about $900 billion and the two do not reconcile. Spot gold eased to $4,285 an ounce on 14 September, by USAGOLD's daily market report. We could not establish which price or which tonnage estimate the conference slide used, and the deck does not say.
The yuan wedge rests on an unstated rate
China's M2 stood at 356.7 trillion yuan in June 2026, the latest monthly print from the People's Bank of China as carried by Trading Economics. Turning that into $52.8 trillion implies a conversion near 6.76 yuan to the dollar. The slide gives no rate and no date for it. The euro at $18.9 trillion, the yen at $10.0 trillion, the pound at $4.3 trillion and the $15.1 trillion bucket labeled other fiat currencies sit in the same position: none could be matched to a central-bank series by publication time, and they are reported here as the conference account published them.
What a 1% share does not settle
"Bitcoin is going global and it's only growing," the post said.
That is the author's claim, and the chart does not test it. A 1% share is a ratio between one asset's market value and a set of money-supply aggregates, and the two are not the same kind of number. M2 counts deposits that can be spent tomorrow. A market capitalization is the last traded price multiplied by the coins in existence, and it does not survive contact with a large seller. Gold invites the same objection, which is why the metal keeps turning up beside Bitcoin in these comparisons, and why the 90-day correlation between the two has topped 50%.
What the chart does establish is scale. On its own numbers, the dollar wedge alone is fourteen times the Bitcoin wedge, and the yuan wedge is thirty-three times it. The slide carries no date. Until it does, the gold and yuan figures stand unverified, and only the dollar wedge can be checked against a published series.
Read also: Bitcoin at $1.2M Would Match Dollar M2, a Viral Slide Deck Says