
What Is Market Structure in Trading?
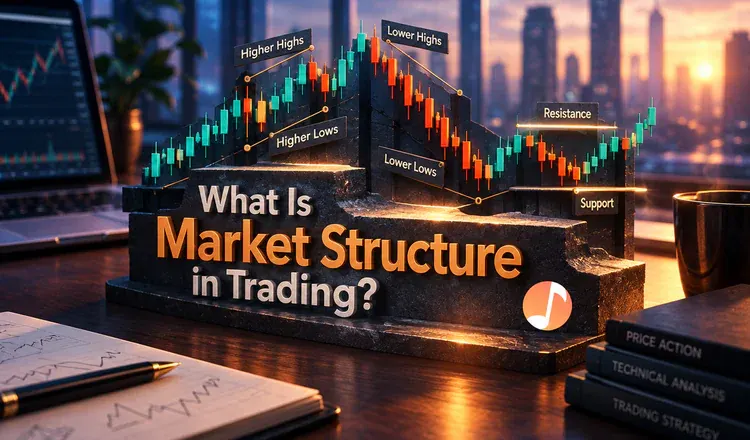
Market structure is simply the pattern that the highs and lows on a chart make. Higher highs with higher lows is an uptrend. Lower highs with lower lows is a downtrend. Anything else is a range. Reading it is the first skill underneath almost every price-action method, and it needs no indicators at all - only the candles that are already on the screen.
The three states
- Uptrend - each peak above the last, each dip shallower than the last. Bitcoin through a strong month looks like this.
- Downtrend - each peak lower, each trough lower. Rallies inside it tend to stall sooner than they look like they will.
- Range - highs and lows roughly level. The chart is going sideways, and trend-following methods misfire here more than anywhere else.
How do you mark it on a chart?
Find the obvious turning points, the places where price clearly reversed and left a peak or a trough behind. Ignore the small wobbles; if you have to squint to see a swing, it is not one. Then read the sequence out loud. Four peaks each above the one before, with pullbacks that never reach the previous low, is an uptrend, and that is the entire reading. Zoom out before you decide anything, because the same afternoon can be an uptrend on a fifteen-minute Ethereum chart and a small bounce inside a falling daily one. When the two disagree, the longer timeframe usually sets the tone.
Why bother reading it at all?
Because it tells you which direction you would be arguing with. Buying into a clean downtrend is not forbidden, but it is a harder trade than buying in an uptrend, and knowing which one you are in costs nothing. It is also the ground the rest of the vocabulary stands on - breaks, shifts, order blocks, all of it is just a description of structure changing.
Try it on a chart with the indicators switched off: mark the last six swing highs and lows, name the state, then check whether the past week agreed with you. Next, what a break of structure is, and for where traders mark their zones, order blocks explained.